Since we first launched DexGuru in April 2021, many things have changed. Our platform is constantly improving to meet your DeFi needs.
We have a lot of updates, but we don’t always summarize it in a bite-sized form. So to keep our vibrant community posted, every few months, we will publish a short breakdown of what’s done and achieved. Here is a quick look at the updates that we have released. We are also working on some other stuff that is yet to be released. Let’s dive deeper into features to see how each of them can improve your trading experience.
Where we are
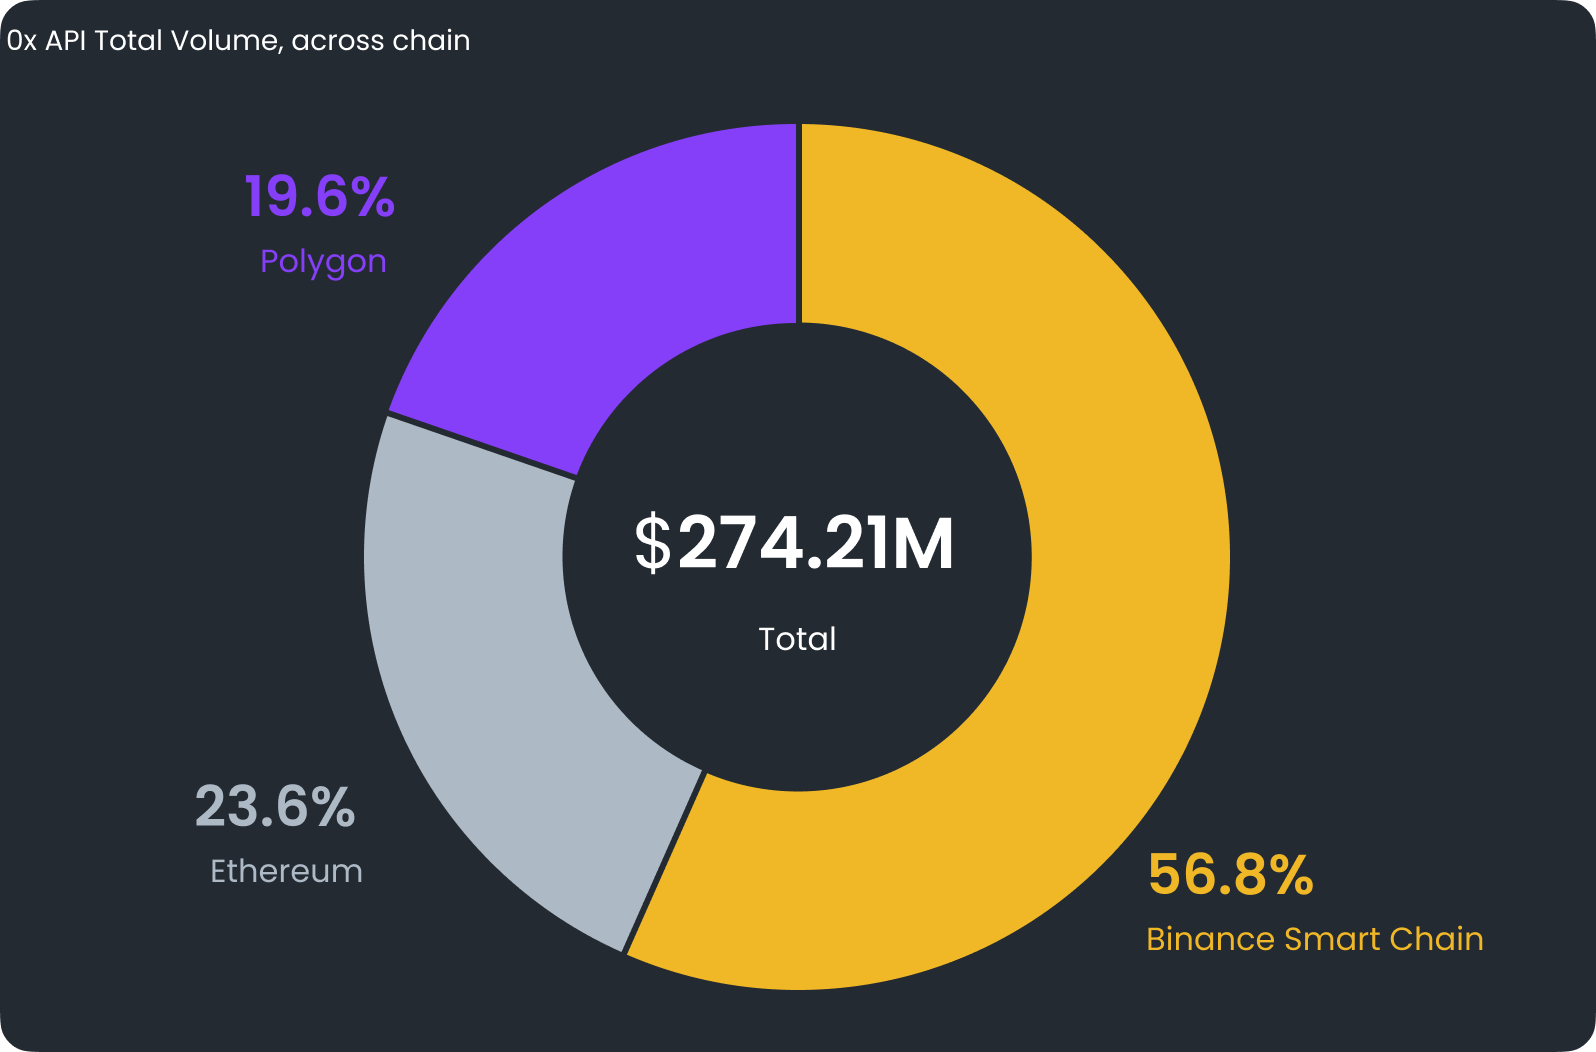
Everything is transparent on-chain and available 24/7, but no one is looking at this data because of sheer magnitude and lack of tools for market analysis. Our long term goal is to make it easy to leverage on-chain market data in a simple, understandable way so traders can finally take advantage of it. Since our launch in April, our traders community did about $274M in trading volume and settled almost 280,000 trades YTD across all supported chains combined. Here is a live 0x API dashboard with our trading stats.
Apart from trading volume, another essential metric to see is the website traffic, where we are constantly hitting 10M monthly pageviews with about 70-100K of daily visitors. Since we strive for transparency, our Google Analytics data is open at SimilarWeb.
What’s new
DexGuru with Binance Smart Chain and Polygon Network
Besides charting and trading any tokens with a liquid on-chain market on the Ethereum network, you can now chart and trade any tokens on the BSC and Polygon (previously Matic) networks.
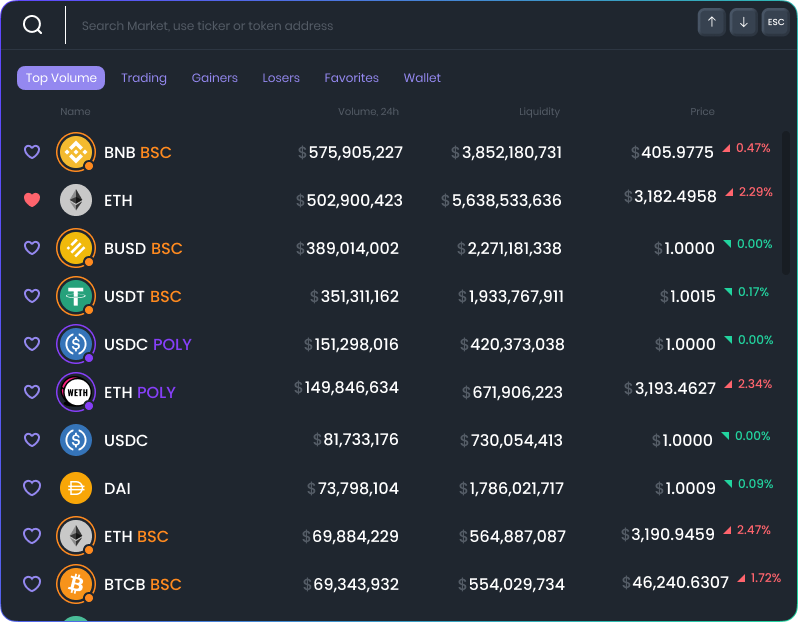
Today we have real time charting and data for 312,000 tokens/363,000 trading pairs across Ethereum, BSC and Polygon on-chain markets.
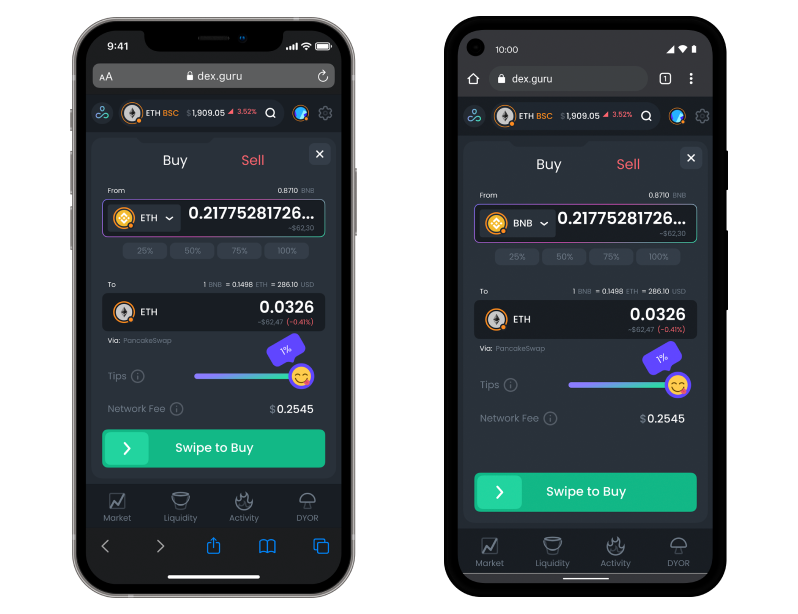
Use DexGuru on your phone
Dig into crypto markets anytime, anywhere on your phone. To reap the full benefits of our platform and trade on your phone, you need to use a browser inside the web3 wallet app like MetaMask.
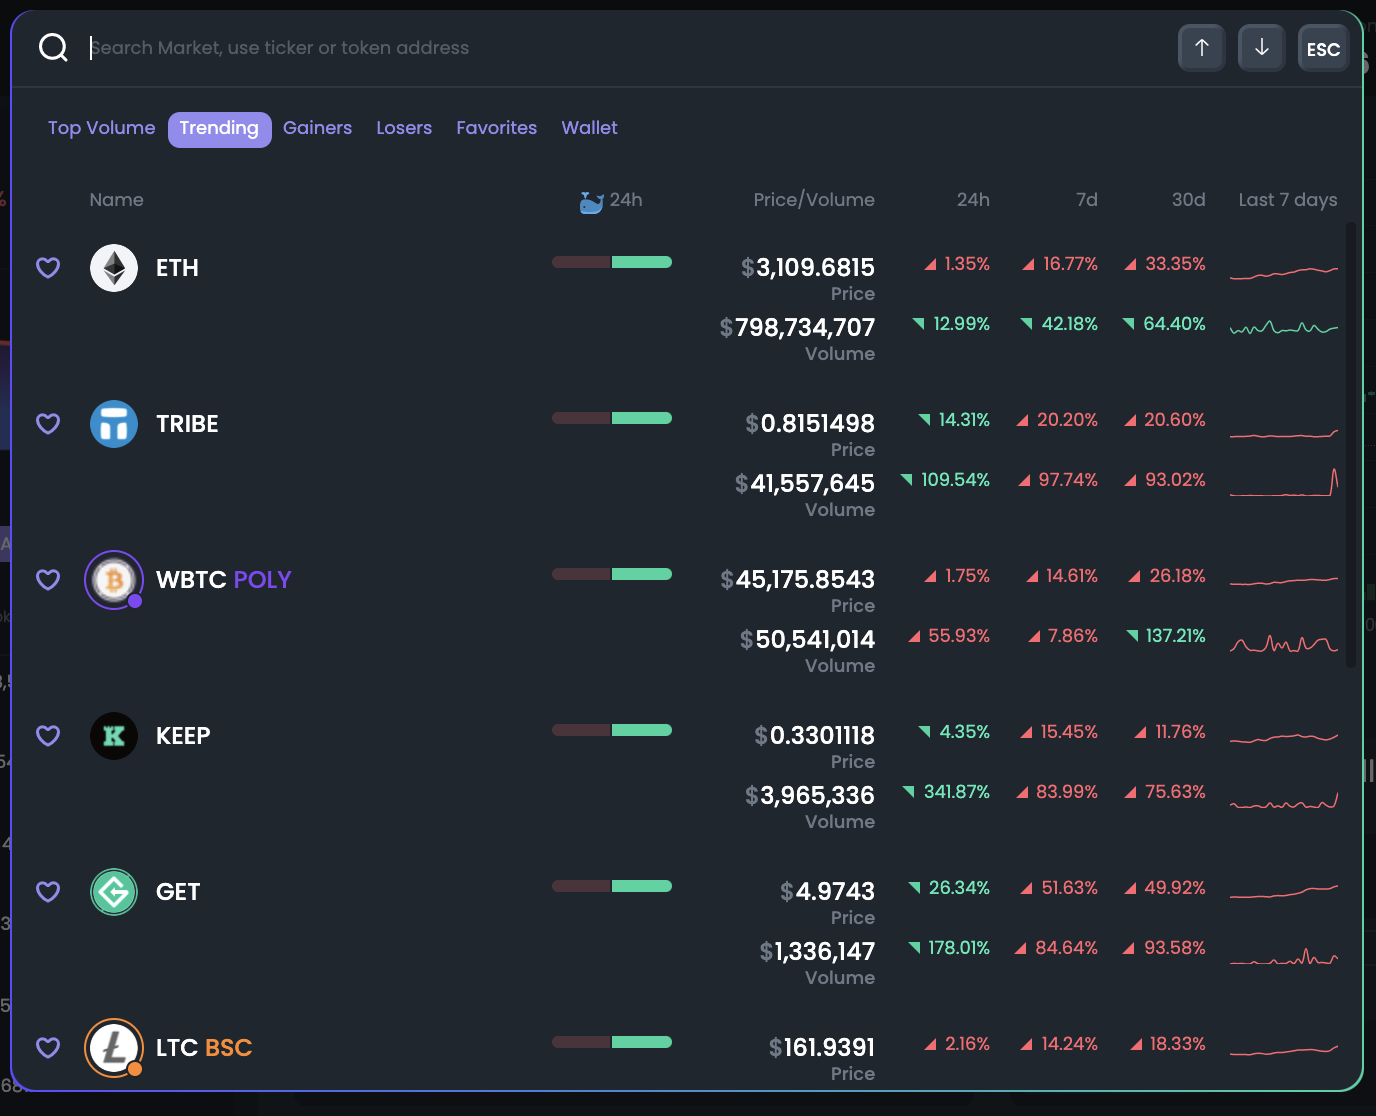
Quickly identify tokens that are currently trending and tokens that are losing or gaining their value
We added three new tabs to our Market Selector. They are Trending, Gainers and Losers.

The Gainers and Losers tabs show tokens that gained or lost the most value over the last 24 hours.
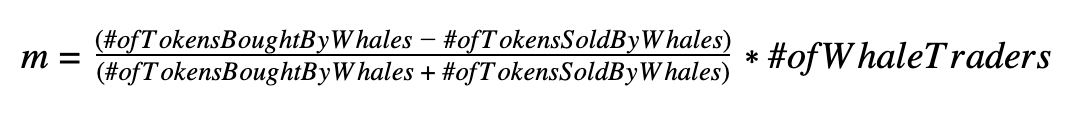
Trending Tab shows tokens where Whale 🐳 buyers are strongly dominating over Whale 🐳 sellers. Whale 🐳 traders are the ones that have $500k+ in trading volume over the previous 30 days. The Trending tab is updated every hour.
We calculate value m that represents the difference between buy volume and sell volume of Whale 🐳 traders over the last 24 hours. You can see the formula for m below. The m value is similar to the Speculative Sentiment Index. If m value is negative, it means more tokens have been sold than bought. If m is positive, it means more tokens have been bought than sold. When we calculate the Trending tab, we consider the maximum and the minimum m values for the previous 30 days. We use our custom k indicator similar to the stochastic oscillator to determine what tokens are listed in the Trending tab. The k indicator value ranges between 0 and 100. When k is bigger than 60, the token is considered for the Trending tab. The k indicator shows how close the current m value is to the maximum m over the last 30 days.
Evaluate tokens by using our new Market Screener
We use the same algorithm for our new Token Screener that show how many transactions have been made by the traders that correspond to specific Trader Categories defined below.

Trader Categories:
- 🐢 - Casual Trader with $10k-$100k of a trading volume in the last 30 days
- 🦈 - Active Trader with $100k-$500k of a trading volume in the last 30 days
- 🐳 - Heavy Trader with $500k+ of a trading volume in the last 30 days
Save custom chart templates in the dashboard
Charts can provide you with essential insights into the crypto market. Technical Analysis heavily relies on charts, and graphs can get very specific. You can now save your custom chart settings for future use. To use this feature, you need to connect your wallet first. To save any chart settings, use the cloud button in the top right corner of the chart section.

You can save multiple chart layouts. To see the list of previously saved configurations, use the dropdown menu next to the cloud button.

View your wallet’s trading history
Besides seeing a real-time trading history for a token, you can now see your own orders history of the token using the “My orders” button.

Explore the crypto market more efficiently with new shortcuts ~
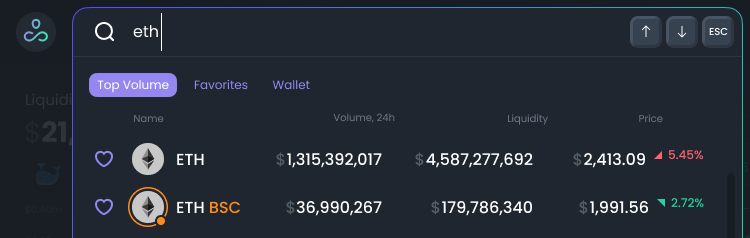
If you are a fan of keyboard shortcuts, you are going to like this feature. There is no need to use your computer mouse to open our Market Selector; use hotkeys instead. Just press the ~ key to open it. Use ↑ ↓ and ESC keys to navigate around and close the Market Selector.

Coming Soon ™️
- Stay on top of things with our web browser notifications
Once we release our push notifications, you can forget about wasting your time by constantly looking up tokens’ prices and trading volumes. You will be able to set custom thresholds that trigger push notifications inside your browser. To start receiving push notifications, you will need to enable them in your dashboard settings and add desired tokens to your Favorites.
- Add DexGuru bot to your Discord server
Our bot will provide the DeFi community on Discord with simple, highly customizable on-chain market alerts. You will be able to create alerts about prices, liquidity pool changes, large transactions, and volume spikes.
- Create anything with DexGuru API
We are in the process of building an instant API that provides developers with the most reliable on-chain market data for Ethereum, BSC, and Polygon blockchains. We want to inspire people to develop new projects. Are you going to build a portfolio tracking tool? Trading bot? Do you want to use our data for your academic research? The possibilities are endless! Join our Public API waitlist here to get notified about the launch.